AutoCAD 2000i has added the capability of assigning any color to objects in your drawing. You can define the color using the Red-Green-Blue system (RGB) or the Hue, Saturation, Value system to create any color you want, such as an object’s true color in real life. To use this feature, you need to create or edit a plot style. (For the details on plot styles, see pp. 520-530 of my AutoCAD 2000 Bible.) To assign any color to an object, follow these steps:
Choose File > Plot Style Manager.
Double-click Add-a-Plot Style Table Wizard.
Go through the wizard until you reach the Finish screen. You’ll probably want to use the current plot style table as a basis instead of starting from scratch.
Click Plot Style Table Editor.
Choose one of the existing styles or add a new style. (If you are using color-dependent plot style tables, choose a color. These steps assume you are using named plot styles.) Name it and add a description.
In either Form View or Table View, click Color to access the drop-down list. At the bottom of the list, choose the new True Color option top open the True Color dialog box.
Specify the color you want by dragging the arrows in the Hue/Value area at the left or typing red, green, blue or Hue, Sat, or Val values.
Click OK when you are finished.
Click Save & Close.
Click Finish to close the Wizard.
To see the results of the new plot style, you need to assign it to a layout, then to an object, as explained on pp. 527-528 of AutoCAD 2000 Bible. Here are brief steps:
Right-click the tab you want to use and choose Page Setup. Click the Plot Device tab and choose the plot style table containing the plot style you created. Check Display Plot Styles and click OK. With the same layout active, select the object that is supposed to get your new color. Choose Properties from the Standard toolbar and choose the Plot Style item in the Properties window. Choose the plot style you created from the drop-down list.
You can check out how the object will look in a full preview of a plot.
Paul Burgener sent in a tip for helping to decide which of the 255 AutoCAD colors to use. He mentions that different printers produce slightly different results and even the paper can affect the color. AutoCAD provides two drawings, colorwh.dwg and plot screen and fill patterns.dwg that display the 255 colors. You can also print lineweights.dwg to see how your lineweights will look.
Column text was introduced in AutoCAD 2008. Columns make fitting your text into tight spaces easier; it also looks more professional. You may have manually created columns in the past, but when you edited the text, the columns didn’t automatically readjust, leading to awkward spaces or lots of reformatting.
Follow these steps to create column text:
Start the MTEXT command. Specify the bounding box. In 2009 & 2010, the Text Editor tab appears. In 2008, you’ll see the Text Formatting toolbar.
Enter the text and format it however you want.
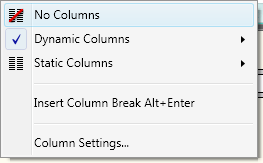
In 2010, from the Insert panel, choose Columns, then choose a sub-option. In 2008, click the Columns button (the leftmost button) on the Options toolbar (the lower toolbar).
I chose the Dynamic Columns option. Dynamic columns let you dynamically flow the text as the space changes. Watch the video to see how you can then drag the bottom border up and create two columns.
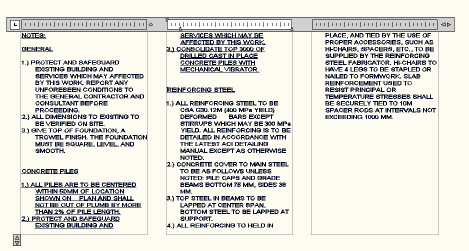
If you want to specify the number of columns, you can choose the Static Columns option, then you choose the number of columns. Here you see the text after I chose 3 columns.
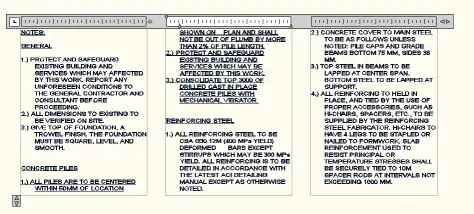
I can still drag on the double-arrow at the bottom to change the flow. Below you can see how I evened out the columns.
I can also drag the double-arrow at the upper-right to adjust the overall width.
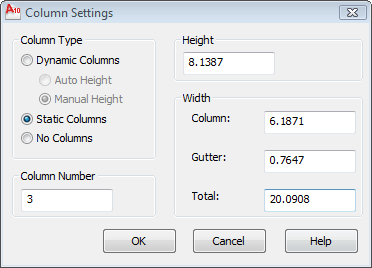
Finally, choose Column Settings from the Column drop-down list to specify column widths and gutter (the space between the columns).
Don’t know which font to use? Until AutoCAD offers a WYSIWYG font drop-down list (send in your wish lists, folks!), you can print out truetype.dwg, which comes with AutoCAD in the /Sample folder. It probably doesn’t contain all the fonts on your computer but does have a sample of enough fonts for most people.
Do you change your plot settings a lot? Do you plot drawings in various ways, for example, a draft plot and a final plot? Or do you create various layouts and need to plot them differently?
You can save page setups, which contain settings for plotting. A page setup is attached to a layout, so you can easily switch settings from one layout to another.
Creating a page setup is like specifying plotting settings, so you should know how to use the Plot dialog box first.
Top Customization Tips Every AutoCAD User Should Know
AutoCAD is meant to be customized, but customization is one of the most complex features of AutoCAD. Gain the knowledge you need to be a master at customizing AutoCAD!
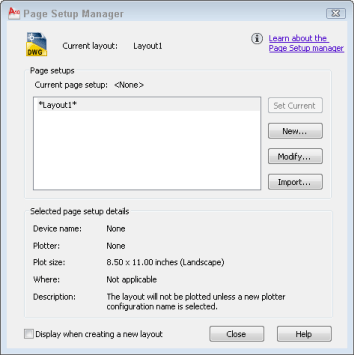
To create a new page setup, right-click the desired tab (including the Model tab), and choose Page Setup Manager. (If you don’t see the layout tabs, you have model and layout buttons on the status bar. Right-click either button and choose Display Layout and Model tabs.)
In the Page Setup Manager, click New. Enter a name. If you have existing page setups, you can choose one from the Start With list, to avoid having to create all the settings from scratch. Click OK.
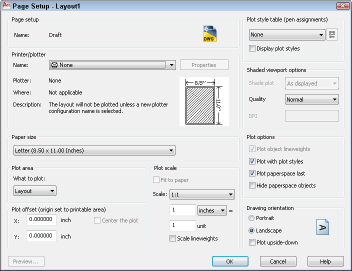
In the Printer/Plotter section, choose the desired printer or plotter from the drop-down list. This lets you use different devices for different layouts.
In the Paper Size section, choose a paper size. This allows you to use different sheet sizes for different layotus.
In the Plot Area section, choose what you want to plot. Your choices depend on whether you’re on a Model or Layout tab, and can include: Layout, Display, Limits, Extents, and Window.
In the Plot Offset section, you can specify an offset from the lower-left corner. You might do this to place several plots on different parts of one sheet of paper. You can also cneter the plot by checking the Center the Plot check box.
In the Plot Scale section, set the scale from the drop-down list, or check the Fit to Paper check box. You can also type a scale int eh text boxes. Most layouts are plotted at 1:1 because you scale the individual viewports. You can also check the Scale Lineweights check box to scale the lineweights along with your drawing.
In the Plot Style Table section, choose a plot style table if you want to use one. Plot styles determine how plots look and let you create different looks for different plots.
In the Shaded Viewport Options section, you specify how a model plot (not a layout plot) looks. You can choose from visual styles and resolution options. The Shade Plot drop-down list is not available if you’re on a Layout tab. You can also choose a quality from the Quality drop-down list.
In the Plot Options section, you can choose whether or not you want to plot lineweights and plot styles. You can also choose whether you want to plot paper space objects last. Finally, if you created 3D objects in paper space (who ever does that?), you can hide their back lines.
In the Drawing Orientation section, you can plot portrait, landscape (the default), or upside down.
Click the Preview button to see if you like the result.
Click OK to return to the Page Setup Manager. Select the new page setup, click Set Current, and click Close.
To modify a page setup, open the Page Setup Manager again, choose the page setup, and click Modify.
To use the page setup, start the PLOT command. In the Plot dialog box, choose the page setup from the Name drop-down list in the Page Setup section at the top of the dialog box. Then plot the drawing.
AutoCAD supports Autodesk’s DXF (Drawing Interchange File) format, which is a text-only format that contains a 2D drawing’s information. The DXF format is often used to exchange drawings between different CAD programs.
You can save a drawing in DXF format and you can open a DXF file in AutoCAD and save it as a drawing. Try this round-trip exercise.
Open a new drawing based on the default acad.dwt template.
Draw one line.
Save the drawing.
Choose File> Save As (in 2009, choose Menu Browser> File> Save As). From the Files of Type drop-down list in the Save Drawing As dialog box, choose the most recent DXF option (such as AutoCAD 2007 DXF (*.dxf).
Leave the default file name and click Save.
Close the drawing. (AutoCAD may ask you to save again in DWG format.)
Open Notepad. Choose File> Open.
In the Open dialog box, click the drop-down list that displays Text Documents (*.txt) and choose All Files (*.*).
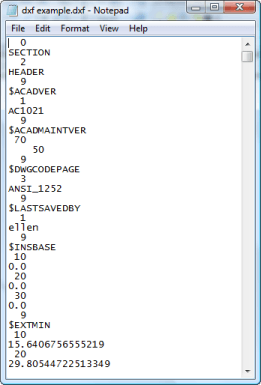
Choose the file you just created and click Open. You’ll see something like this:
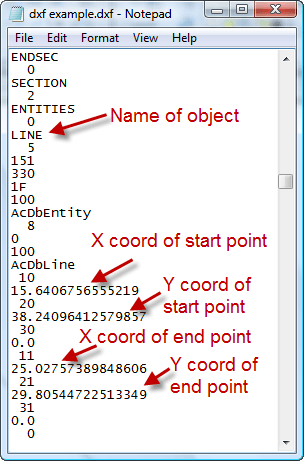
In Notepad, press Ctrl + F and enter entities to find the section that contains entities (drawing objects). Here’s a crib sheet for what you’ll see:
Now you know a few of the DXF codes:
0: Name
10: X coordinate of start point (of a line)
20: Y coordinate of start point (of a line)
11: X coordinate of end point (of a line)
21: Y coordinate of end point (of a line)
Note: You can find all the codes in AutoCAD Help. In the Help window, click on Contents tab> AutoLISP, Visual LISP, and DXF> DXF Reference. There, you can look in the ENTITIES section for the specific codes as they apply to specific objects.
Return to AutoCAD and click Open from the Standard or Quick Access toolbar.
In the Select File dialog box, from the Files of Type drop-down list, choose DXF (*.dxf).
Choose the file you just created and click Open. The DXF file opens with your line displayed.
You can modify a drawing by editing its DXF file. Follow these steps:
In AutoCAD, use the ID command to check out the coordinates of the start and end point of the line. Write down the numbers.
In AutoCAD, close the DXF file. Don’t save changes if prompted, because this will change the DXF file.
Go back to the DXF file in Notepad.
Change the numbers after the 10, 20, 11, and 21 codes. Don’t change anything else.
Save the file.
Re-open the file in AutoCAD. Your line is now different, using the X and Y coordinates that you specified in the DXF file in Notepad.
Now, let’s say that you have some text that you want to globally change, such as block attributes. Perhaps you want to change all instances of AB to CD. You can use the -ATTEDIT command to create global changes in attribute values, but perhaps you prefer to do this in a text environment. Here’s how to do this:
Save the drawing as a DXF file.
Open the DXF file in Notepad.
Use the Find feature to search for AB. When you find it, change it to CD.
Continue on in this way.
You can even open the DXF file in WordPad or Microsoft Word and use the Replace feature. However, I don’t recommend using the Replace All button, because DXF files insert lots of codes that may have the text string you want to change.
When you’re done, save the file, re-open it in AutoCAD and the drawing will have the changes you made. Don’t forget to save in DWG format again
You can use the EXPLODE command to break up the block into its components, but you don’t have control over layer, color, linetype, and so on. The XPLODE command gives you that control.
Here’s how it works:
Type xplode on the command line.
At the Select objects: prompt, select one or more blocks.
If you select more than one block, the next prompt is XPlode Individually/<Globally>: If you want to give different blocks different properties, use the Individually option; AutoCAD highlights each block in turn and you can apply the options to each one.. Otherwise, use the default Globally option.
At the next prompt, choose one of the options described below.
Here’s how to use the options:
All: Lets you specify color, layer, linetype, and lineweight
Color: Lets you specify color, by name or number. You can specify true colors using RGB or color book specifications.
LAyer: Lets you specify the layer
LType: Lets you specify the linetype
LWeight: Lets you specify the lineweight
Inherit from parent block: Applies to blocks created on layer 0 whose color and linetype were set to ByBlock. The ByBlock objects retain their color and linetype after you explode them.
Explode: Does a simple explode operation (the default)
Note that XPLODE doesn’t explode blocks that have unequal absolute X and Y scales, such as a block that you scaled x=2 and y=3.
Do you use XPLODE? How does it help you. Leave a comment!
Since AutoCAD 2008, you can refine table styles with cell styles, which define formatting for table cells. A cell style is part of a table style, but has its own name. Follow these steps to create a cell style.
Choose Draw> Table or choose Home tab> Annotate panel> Table to open the Insert Table dialog box.
In the Table Style section, click the Launch the Table Style Dialog button.
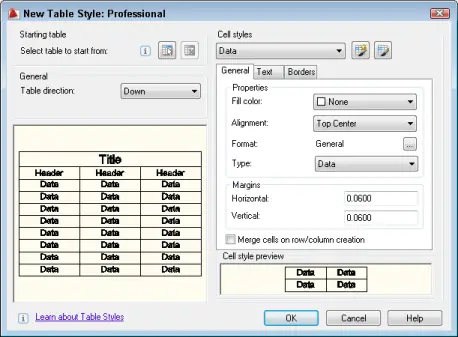
In the Table Style dialog box, click New. Then enter a name and a style to start with. Click Continue. The New Table Style dialog box opens.
Note: You format the cells using the Cell Styles section on the right side of the dialog box. You use three tabs, General, Text, and Borders. These settings apply to three types of cell styles: Data, Header, and Title, which you choose from the drop-down list at the top of the section. The cell style applies to only one type of cell style, meaning that you would most often have at least three cell styles for a table — one for the title, one for the column headers, and one for the data.
To save a new cell style, click the Create a New Cell Style button. If you omit this step, you format the table’s cells, but don’t save a named style that you can use in the future. In the Create New Cell Style dialog box, enter a name. You can choose a cell style to start with or leave the default. Click Continue. The new cell style name now appears on the drop-down list.
On the General tab, choose a Fill color from the drop-down list.
Choose an alignment from the Alignment drop-down list. This refers to text alignment, but is on the General tab, not the Text tab.
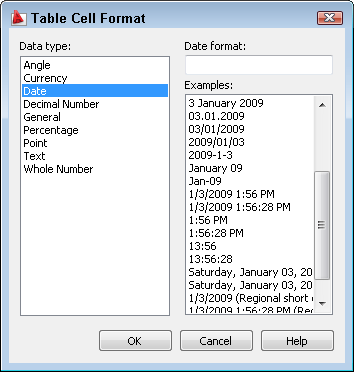
To change the format, click the Ellipsis button to open the Table Cell Format dialog box. The settings here are somewhat similar to those you have when you format cells in Microsoft Excel. You can format angles, currency, dates, decimal numbers, percentages, points, text, and whole numbers. Except for the General and Whole Number types, you can choose from various formats.
From the Type drop-down list, choose Data or Label. The purpose of the Label type is to function as a table header or column title. If you break a table into sections, you can repeat label cells in each section. For a data cell, use the Data option.
In the Margins section, specify horizontal and vertical margins. The margin is the space between the text and the cell border.
On the Text tab, choose a Text style from the Text Style drop-down list, or click the Ellipsis button to open the Text Style dialog box and define a text style from scratch.
Enter a value in the Text Height box.
From the Text Color drop-down list, choose a color. The default is ByBlock.
Enter a value in the Text Angle box. The default is 0, of course.
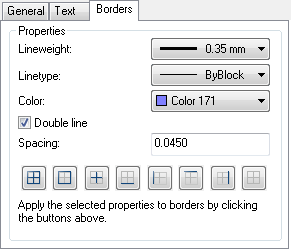
On the Borders tab, choose an option from the Lineweight drop-down list.
Choose an option from the Linetype drop-down list.
Choose a color from the Color drop0dnw list.
If desired, check the Double Line check box to create a double border.
From the Border buttons, choose an option. These options define whether the cells have inside borders, outside borders, or both.
Note: If you use only outside borders, you’ll still see grid lines between the cells in your drawing, but they won’t plot.
Repeat the process from Step 4 to create a cell style for your headers and then again for the table’s title. If you need various types of data formatting, such as dates, numbers, and text, create a cell style for each type.
When you’re done creating cell styles, click OK.
In the Table Style dialog box, your new talbe style should be selected. If not, select it and click Set Current. Click Close. In the Insert Table dialog box, your table style should appear in the Table Style drop-down list.
In the Set Cell Styles section of the Insert Table dialog box, choose the cell styles that you want for the first row (usually a title style), second row (usually a header style), and all other rows (usually a data style).
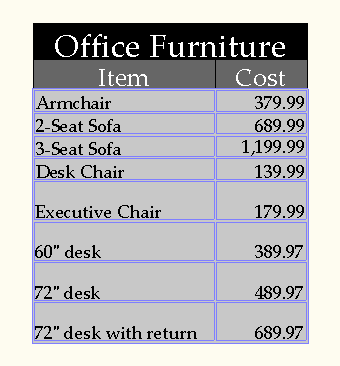
Click OK and specify an insertion point for the table. The table appears. Enter the data; it automatically takes on the appropriate styles.
If you have more than one data style, select some data cells by dragging across them, right-click, and choose Cell Style, then the specific style that you want. Here, the left data column uses a text style and the right column uses a currency style.
Blocks can contain attributes, which are labels with properties. For example, you can use attributes to attach price and manufacturer information to a block of an office chair.
Once you have the attributes, you can extract them to a simple database and open that database in Microsoft Excel, for example, or insert it as a table in your drawing.
Follow these steps to extract attributes:
Choose Tools>Data Extraction to open the Data Extraction Wizard. (In 2009, choose Blocks & References tab> Linking & Extraction panel> Extract Data.)
On the Begin page, choose the Create a New Data Extraction option, and click Next.
The Save Data Extraction As dialog box opens. You need to save the extraction as a DXE file. Enter a file name, navigate to a location, and click Save.
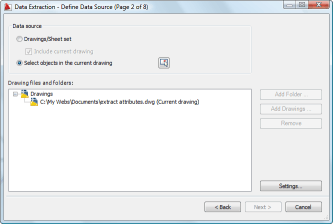
On the Define Data Source page, you can choose the Drawings/Sheet Set option which lets you extract from multiple drawings, or the Select Objects in the Current Drawing option. For this tutorial, choose the latter option.
Click the Select Objects in the Current Drawing button to return to your drawing and select objects. You can select everything in the drawing if you want. When you end selection, you return to the wizard. Click Next.
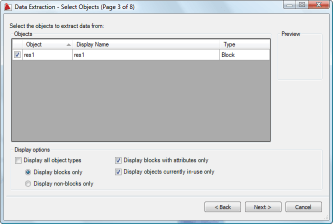
On the Select Objects page, start at the bottom to specify which types of objects you want to display. In most cases, you can uncheck the Display All Object Types check box and check the Display Blocks with Attributes Only check box. Click Next.
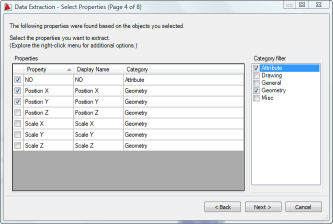
On the Select Properties page, you choose which properties of the objects you want to include. The point here is that you can extract more than just the attributes you created. Here, I chose Attribute and Geometry from the Category list. specifically, I chose Position X and Y geometry properties. Click Next.
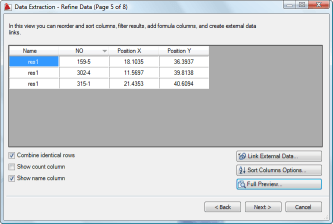
On the Refine Data page, you can specify how your data will appear. You can set sorting options and include links to external data. I unchecked the Show Count Column, because it just showed 1 for each block instance. Click Next.
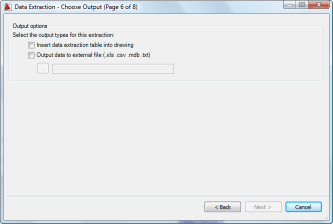
On the Choose Output page, you can insert the results as a table in your drawing, output it to a file (XLS, CSV, MDB, OR TXT), or both. Choose the option(s) you want. If you choose to output to a file, click the ellipsis button below that option. The Save As dialog box opens. Enter a file name, choose the file type, navigate to a location, and click Save. Click Next.
On the Finish page, click Finish. If you chose the table option, you get a prompt for an insertion point.
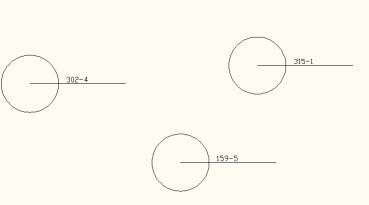
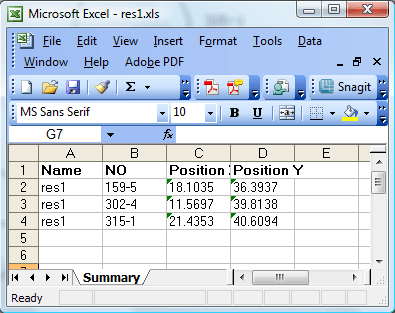
Here’s the drawing with the 3 blocks and their attributes, as well as the database in Excel.
It’s always good to keep to your dimension styles as much as possible, but sometimes a situation requires an exception. You can create an override, which is a sub-dimension style that varies from its parent style.
Follow these steps:
On the Annotate tab, click the Dimensions panel’s dialog box launcher arrow (the arrow at the right end of the panel’s title bar).
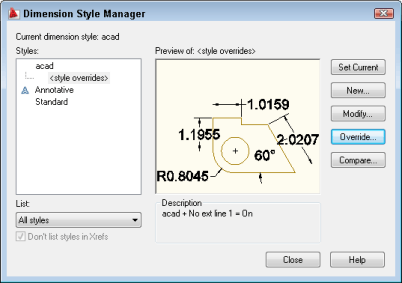
In the Dimension Style Manager, choose the style that you want to override and click Override.
The Override Current Style dialog box opens. This is just like the New Dimension Style dialog box and you make your changes in the same way you would to create a new dimension style.
When you’re done, click OK. The override appears in the Styles pane of the Dimension Style Manager beneath its parent style.
Click Close. Dimensions that you create now use the override settings.
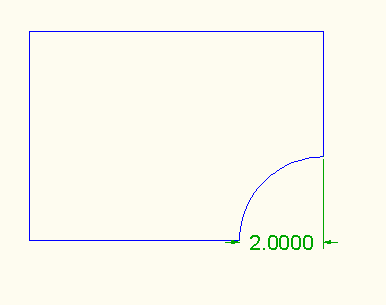
This override suppresses the left extension line.
To stop using the override, again open the Dimension Style Manager and choose the parent style as current. However, this discards the override.
To stop using the override, but save it for later, right-click the override in the Styles panel of the Dimension Style Manager and choose one of the following:
Rename: Creates a new dimension style from the override. Type a new name and press Enter.
Delete: This is the same as choosing the parent style and setting it current
Save to Current Style: Changes the parent dimension to include the override settings
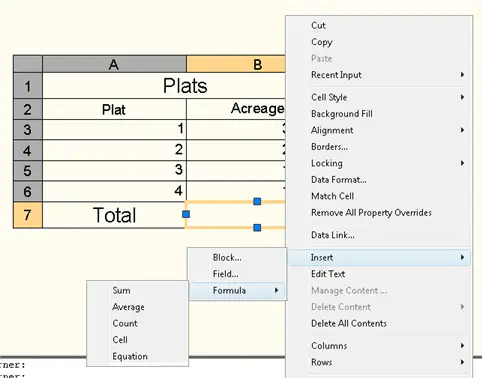
You can add formulas to a table, so that it automatically calculates the following:
Sum
Average
Count (counts the cells in a column or row)
Cell (displays the value of another cell)
Equation (lets you manually insert a formula)
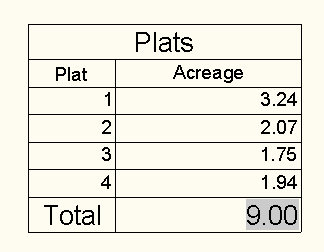
This makes the table work like a spreadsheet.
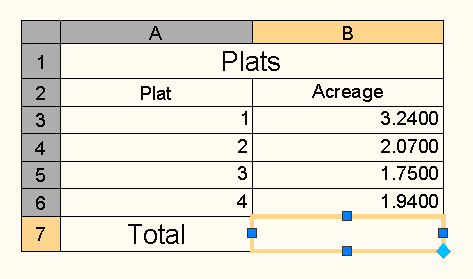
To add a formula, click outside the table to exit editing mode, if you were entering data. Then click the cell where you want to enter the formula, to select it.
Next, right-click the cell, and choose Insert> Formula to display the sub-menu , and choose the formula that you want. Alternatively, on the Table tab, go to the Insert panel, and choose Formula. Then choose the option that you want.
Follow the instructions on the command line. For example, to insert a Sum, Average, or Count formula, you’ll see prompts to select the first and second corner of the cell range that you want to include in the formula. You might have to experiment to find the best place to pick to select the corners.
To enter a formula manually, choose Equation, which inserts the leading equal (=) sign for you. Then enter the equation as you would in a spreadsheet.
Important: While we don't collect cookies, some of our 3rd-party services (such as PayPal and WordPress) do, to give you a safer and better browsing experience. Read about how we use cookies and keep your personal information secure by reading our Privacy Policy here.