Here is a guest blog post from Paul Munford.
Did you know that you can set AutoCAD up to show you exactly how your plot will look, even before you Preview it? (You can click the Preview button in the Plot dialog box to preview your plot.)
It’s easy – when you know how. This technique applies when you use a color-dependent (CTB file) or named (STB file) plot style. Plot styles help you create and save plotting variations and are a great productivity tool. If you aren’t using plot styles, I highly recommend that you check them out. Here are two tutorials to get you started:
Paper Space – It’s a virtual sheet of paper
By default, AutoCAD’s paper space is set up to look like a sheet of paper. The paper has a white background, a black drop shadow and a dotted line around it to indicate the plot area. When you create a viewport in paper space your model space geometry is revealed – in colour… This is not so hot when you are used to seeing your lines, arcs and circles against the dark background of model space.
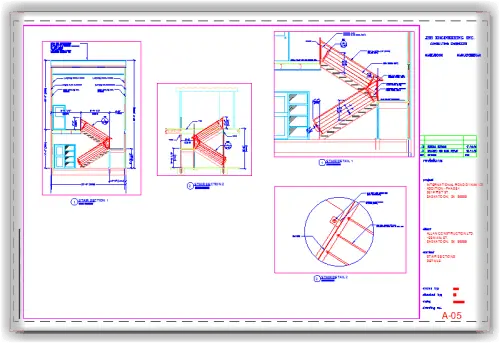
To show how the colours of your geometry will plot when translated by your CTB or STB file, we need to use the Page Setup Manager.
The Page Setup Manager
The Page Setup Manager allows us to save our standard plot settings, so that we don’t have to input the same information every time we plot a drawing (I hope that you have Page Setups created for all your standard plot settings in your template file! If not check out Ellen’s tutorial, Create a page setup for plotting.)
There is one setting in the Page Setup Manager that is often over looked, and can’t be found anywhere else.
To start the Page Setup Manager, use any one of the following:
- Ribbon: Output tab > Plot Panel > Page Setup Manager
- Menu: Application menu (The Big ‘A’) > Print > Page Setup
- Command Line: PAGESETUP
- Or, right-click a layout tab and chose Page Setup Manager.
Click on the Modify button to modify your current page Setup.
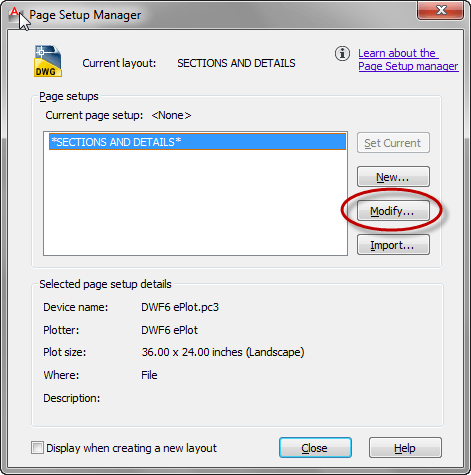
Editing your Page Setu p
p
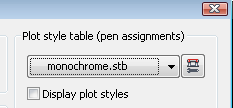
Creating (or editing) a Page Setup is just like creating a plot. The Page Setup dialogue is just like the plot dialogue box, with one important exception — just under the Plot Style table drop-down list is a check box marked Display Plot Styles. Check this box to preview how the selected plot style will look.
That’s it – one simple click and you will be able to see exactly how your CTB or STB file will translate your geometry into plotted lines.
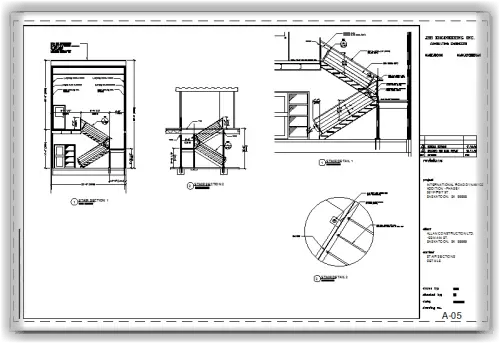
A little finesse

The final step is to turn on lineweight display from the system tray, and there you have it — A permanent plot preview that will show you how your plot will turn out, even while you continue to work on your layout.
Tip: If your viewports start to show in colour again, make the viewport active and perform a regen to re-apply the plot styles. Use the REGENALL command to regen all your viewports at once.
Changing the paper space background colour
Unfortunately, in AutoCAD 2012 it is no longer possible to change the background colour of paper space independently of the paper colour. You can read more about this issue on Shann Hurley’s Blog: Between the lines – AutoCAD layout background color to another color.
Paul Munford is the writer of The CAD Setter Out Blog, with tips, tricks and tutorials for drafters using AutoCAD and Autodesk Inventor to create drawings for Architectural fabrication. In his spare time Paul enjoys drawing and woodworking. He thinks that modelling his joinery designs in 3D is the most fun anyone can have, by themselves…
- Combine or subtract 2D shapes to create custom shapes - February 17, 2022
- Working with linetype scales - January 18, 2022
- Rename named objects–blocks, dimension styles, layers, and more - December 21, 2021

 p
p Instagram
 LinkedIn
 Facebook

All these tips can help you see the final look of a drawing, but you will never account for plotter differences. Xerx vs. Oce you will see a large difference, especially when using shading.
[…] A white Paper space with colour geometry can seem a little odd (particularly if you use a yellow layer colour!). This guest post I recently wrote for Ellen Finkelstien’s AutoCAD tips Blog, shows you how to set your Paper space environment up to show your geometry with your plot style applied. […]
Tried this tip with 2012 using a .CTB Plot Style Table. Paper space changes to B+W but all lineweights are the same. It just doesn’t match the plotted output.
I’m still getting DEFPOINTS layers showing up in my Pspace (plotting with the right CTB and with lineweights on).