
Do you need a way to integrate flexible display into your plots? For example, you may want to produce draft plots that use less ink. Or you may want to plot all in black, or shades of gray. You may want to change solid fills to hatches for some plots.
The way to create multiple plot variations is to use plot styles. You can create as many variations as you want, save them, and use them for any drawing. Plot styles are saved in plot style table files.
There are two kinds of plot style tables: named (*.stb) and color-dependent (*.ctb). Named plot styles are more flexible, but are not the default type of plot style. Your choice of plot style table type is saved in the Windows registry, not in the drawing. To switch, you change the type and then open a new drawing.
In this tutorial, I’ll show you how to create and use a color-dependent plot style that sets the lineweight to 0.05 and the screening to 25%. Screening specifies the amount of ink used for a color and the default is 100%. Setting the screening to 25% is a useful technique for saving ink for a draft plot.
Set the plot style type
To set the plot style type, follow these steps:
- Right-click in the drawing area and choose Options to open the Options dialog box. Then click the Plot and Publish tab.
- Click the Plot Style Table Settings button.
- In the Plot Style Tables Settings dialog box, choose Use Color Dependent Plot Styles or Use Named Plot Styles. You can also specify a default plot-style table other than the standard acad.ctb (color-dependent) or acad.stb (named) plot style. For this tutorial, choose Use Color Dependent Plot Styles, if it isn’t already selected.
- Click OK.
Create a color-dependent plot style table
You’re now ready to create a color-dependent plot style table.
- Choose Application button>Print> Manage Plot Styles to open the Plot Style Manager. You’ll see a Windows Explorer window, like the one you see here. Notice the Add-A-Plot Style Table Wizard shortcut and the other plot style table files that come with AutoCAD — including one that sets screening to 25%.

- Double-click the Add-A-Plot Style Table Wizard shortcut to open the Add Plot Style Table wizard.
- Click Next.
- On the Begin screen, choose the source for your plot style table. For this tutorial, choose Use an Existing Plot Style Table and click Next.

- In the Browse File Name screen, choose acad.ctb, which is the default plot style table. Your new plot style table will be based on this one. Click Next.
- In the File Name screen, enter a file name. I used Draft-screen-lwt. Click Next.
- On the Finish screen, click the Plot Style Table Editor button. The Plot Style Table Editor opens.
You’ve now created a color-dependent plot style table and you’re ready to define a plot style for that table.
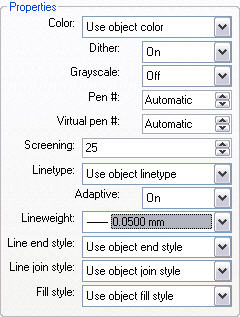
- In the Plot Style Table Editor, click the Form View tab. On the left you see all the colors from 1 to 255. You can select more than one color and make changes on the right to apply those changes to all selected colors.

- Click Color 1 (red). Use the scroll bar to scroll down to the last color, Color 255 (white). Press and hold Shift and click Color 255. This selects all the colors.
- For the Screening item, change the value to 25.
- For the Lineweight item, choose 0.0500.
- Click Save & Close. You’re now back in the last screen of the Add Plot Style Table wizard.
- Click Finish.
You’ve now created a plot style. If you need to edit it, you can access it from several places. One option is to open the Options dialog box as described above and click the Plot and Publish tab. There you can choose Add or Edit Plot Style Tables. You’re now ready to apply your plot style.
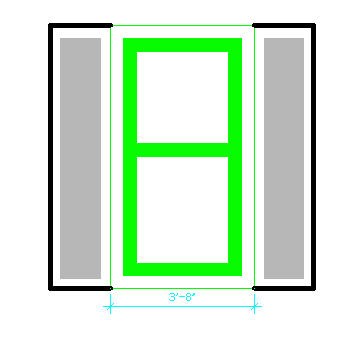
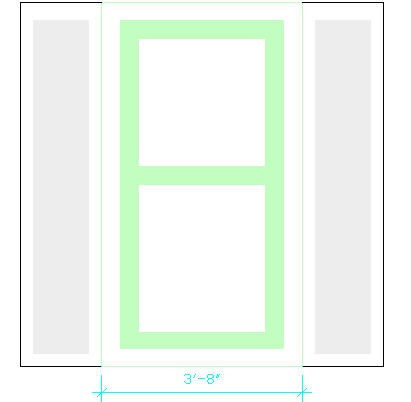
Here’s the drawing. You can see that it uses solid fills in two places and a heavy lineweight around the window shutters.
Attach a plot-style table to a layout
You need to attach a plot-style table to a layout. You can attach different plot-style tables to different layouts to easily create plot variations. Follow these steps:
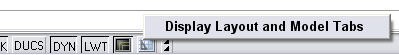
- Open a new drawing and draw some objects. In this case, draw an object with a wide lineweight and fill a closed area with a solid fill, so you will see the contrast when you apply the plot style. Choose a layout tab in your drawing and set up one or more viewports. (If the layout tabs are not displayed, right-click the current layout’s button on the status bar and choose Display Layout and Model Tabs, as shown here.)
- Right-click the layout tab and choose Page Setup Manager.
- In the Page Setup Manager dialog box, choose an existing page setup, if you have one, and click Modify. Otherwise, click New, name the page setup and click OK. You now see the Page Setup dialog box for the layout.
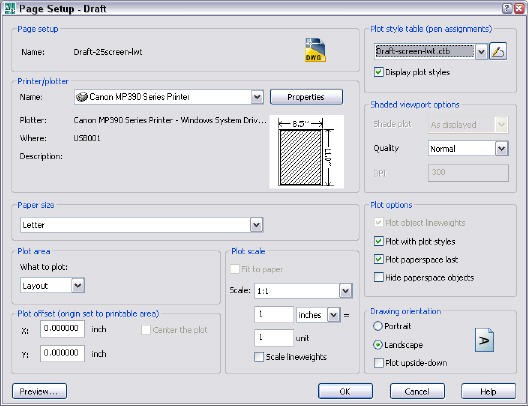
- In the upper-right corner, choose your plot-style table from the Plot Style Table (pen assignments) drop-down list. For this tutorial, you choose Draft-screen-lwt.ctb.
- Just below, check the Display Plot Styles check box. With this box checked, you’ll see the effect of your plot styles on your layouts. (If the Display Plot Styles check box is already checked, you’ll need to use the REGEN command to display the plot style.)
- Click OK.
- In the Page Setup Manager, make sure that the page setup is selected and click Set Current.
- Click Close to return to your layout.
You should now see the results of your page style. Compare the layout below with the drawing I showed earlier.
You can see that the solid fills are much lighter and the lineweight is lighter as well. That will save lots of ink!

- Combine or subtract 2D shapes to create custom shapes - February 17, 2022
- Working with linetype scales - January 18, 2022
- Rename named objects–blocks, dimension styles, layers, and more - December 21, 2021
 Instagram
 LinkedIn
 Facebook

This was completely helpful towards my situation. Written perfectly clearly, though in a professional manner; understood every step. Thank you very much for this, you helped me an aweful lot! Take care!
Thank you for all this information it has been really helpful. I wondered if you could help us locate the architectural standards for AutoCAD line thicknesses etc so we can produce our own plotsyle. Thanks
[…] Tutorial: Create a plot style (color-dependent)AutoCAD tips & tutorials to help you work faster & smarter. CommentsPosts … Tutorial: Create a custom workspace in AutoCAD 2006 and later » … […]
А как создать таблицу стилей печати для реальных цветов : например чтобы цвет 0,153,153 распечать черно белым?
Thanks for this tutorial. Helped me a lot 🙂
Thank you for helping… yet again!
I did what you said and I still get it wrong.
My View is in Color but when I do a preview to plot in is still Black and White. What needs to be fixed.
It is supposed to be in Color and no matter what I do it still previews Black and white.
Help me please.
FIRST YOU CREATE PLOT STYLE SEPARATELY IN 2013 IT WILL SHOW OPTION
STEP 1 SCRATCH FROM START.
STEP 2 CREATE STYLE NAME
STEP 3 THEN WHAT U WANT IN OBJECT COLOR IN PLOT STYLE U SEE THE RIGHT SIDE WINDOW IT WILL SHOW OBJECT COLOR THEN SET COLOR WHAT U WANT.
STEP 4 ONCE SET THE U REQ. COLOR AND THEN CHANGE THE REMAINIG COLORS IN BLACK IN OBJECT COLOR OPTION
I have a requirement that the entities having the same colour as that of the sheet background colour should not be plotted. Will this requirement can be achieved by creating a custom plot style. If so, what settings needs to be edited in the plot style table editor.
I blog often and I truly thank you for your content. The article has really peaked my interest.
I will take a note of your blog and keep checking for new details about once per
week. I opted in for your Feed too.
Thanks, it was a good read.
Thanks for the tutorials very vivid, it was helpfull to my assignment!!
Thanks!
Amazing and very helpful tutorial.Easy to follow and understand.